Getting Started with Honeycomb
Welcome to Honeycomb! This page will walk you through the basics of making your first map.
Accessing Honeycomb
Honeycomb is an app which runs completely in the browser. It is available at app.honeycomb.place.
Layers and Places
Honeycomb is built around data layers and places. Data layers are metrics like population or average income, and places are specific areas that data is aggregated for. You can read more about data layers and places on the concept page: Data Layers and Places
Adding data to the map
As soon as you start Honeycomb, you'll see options for adding data to the map: 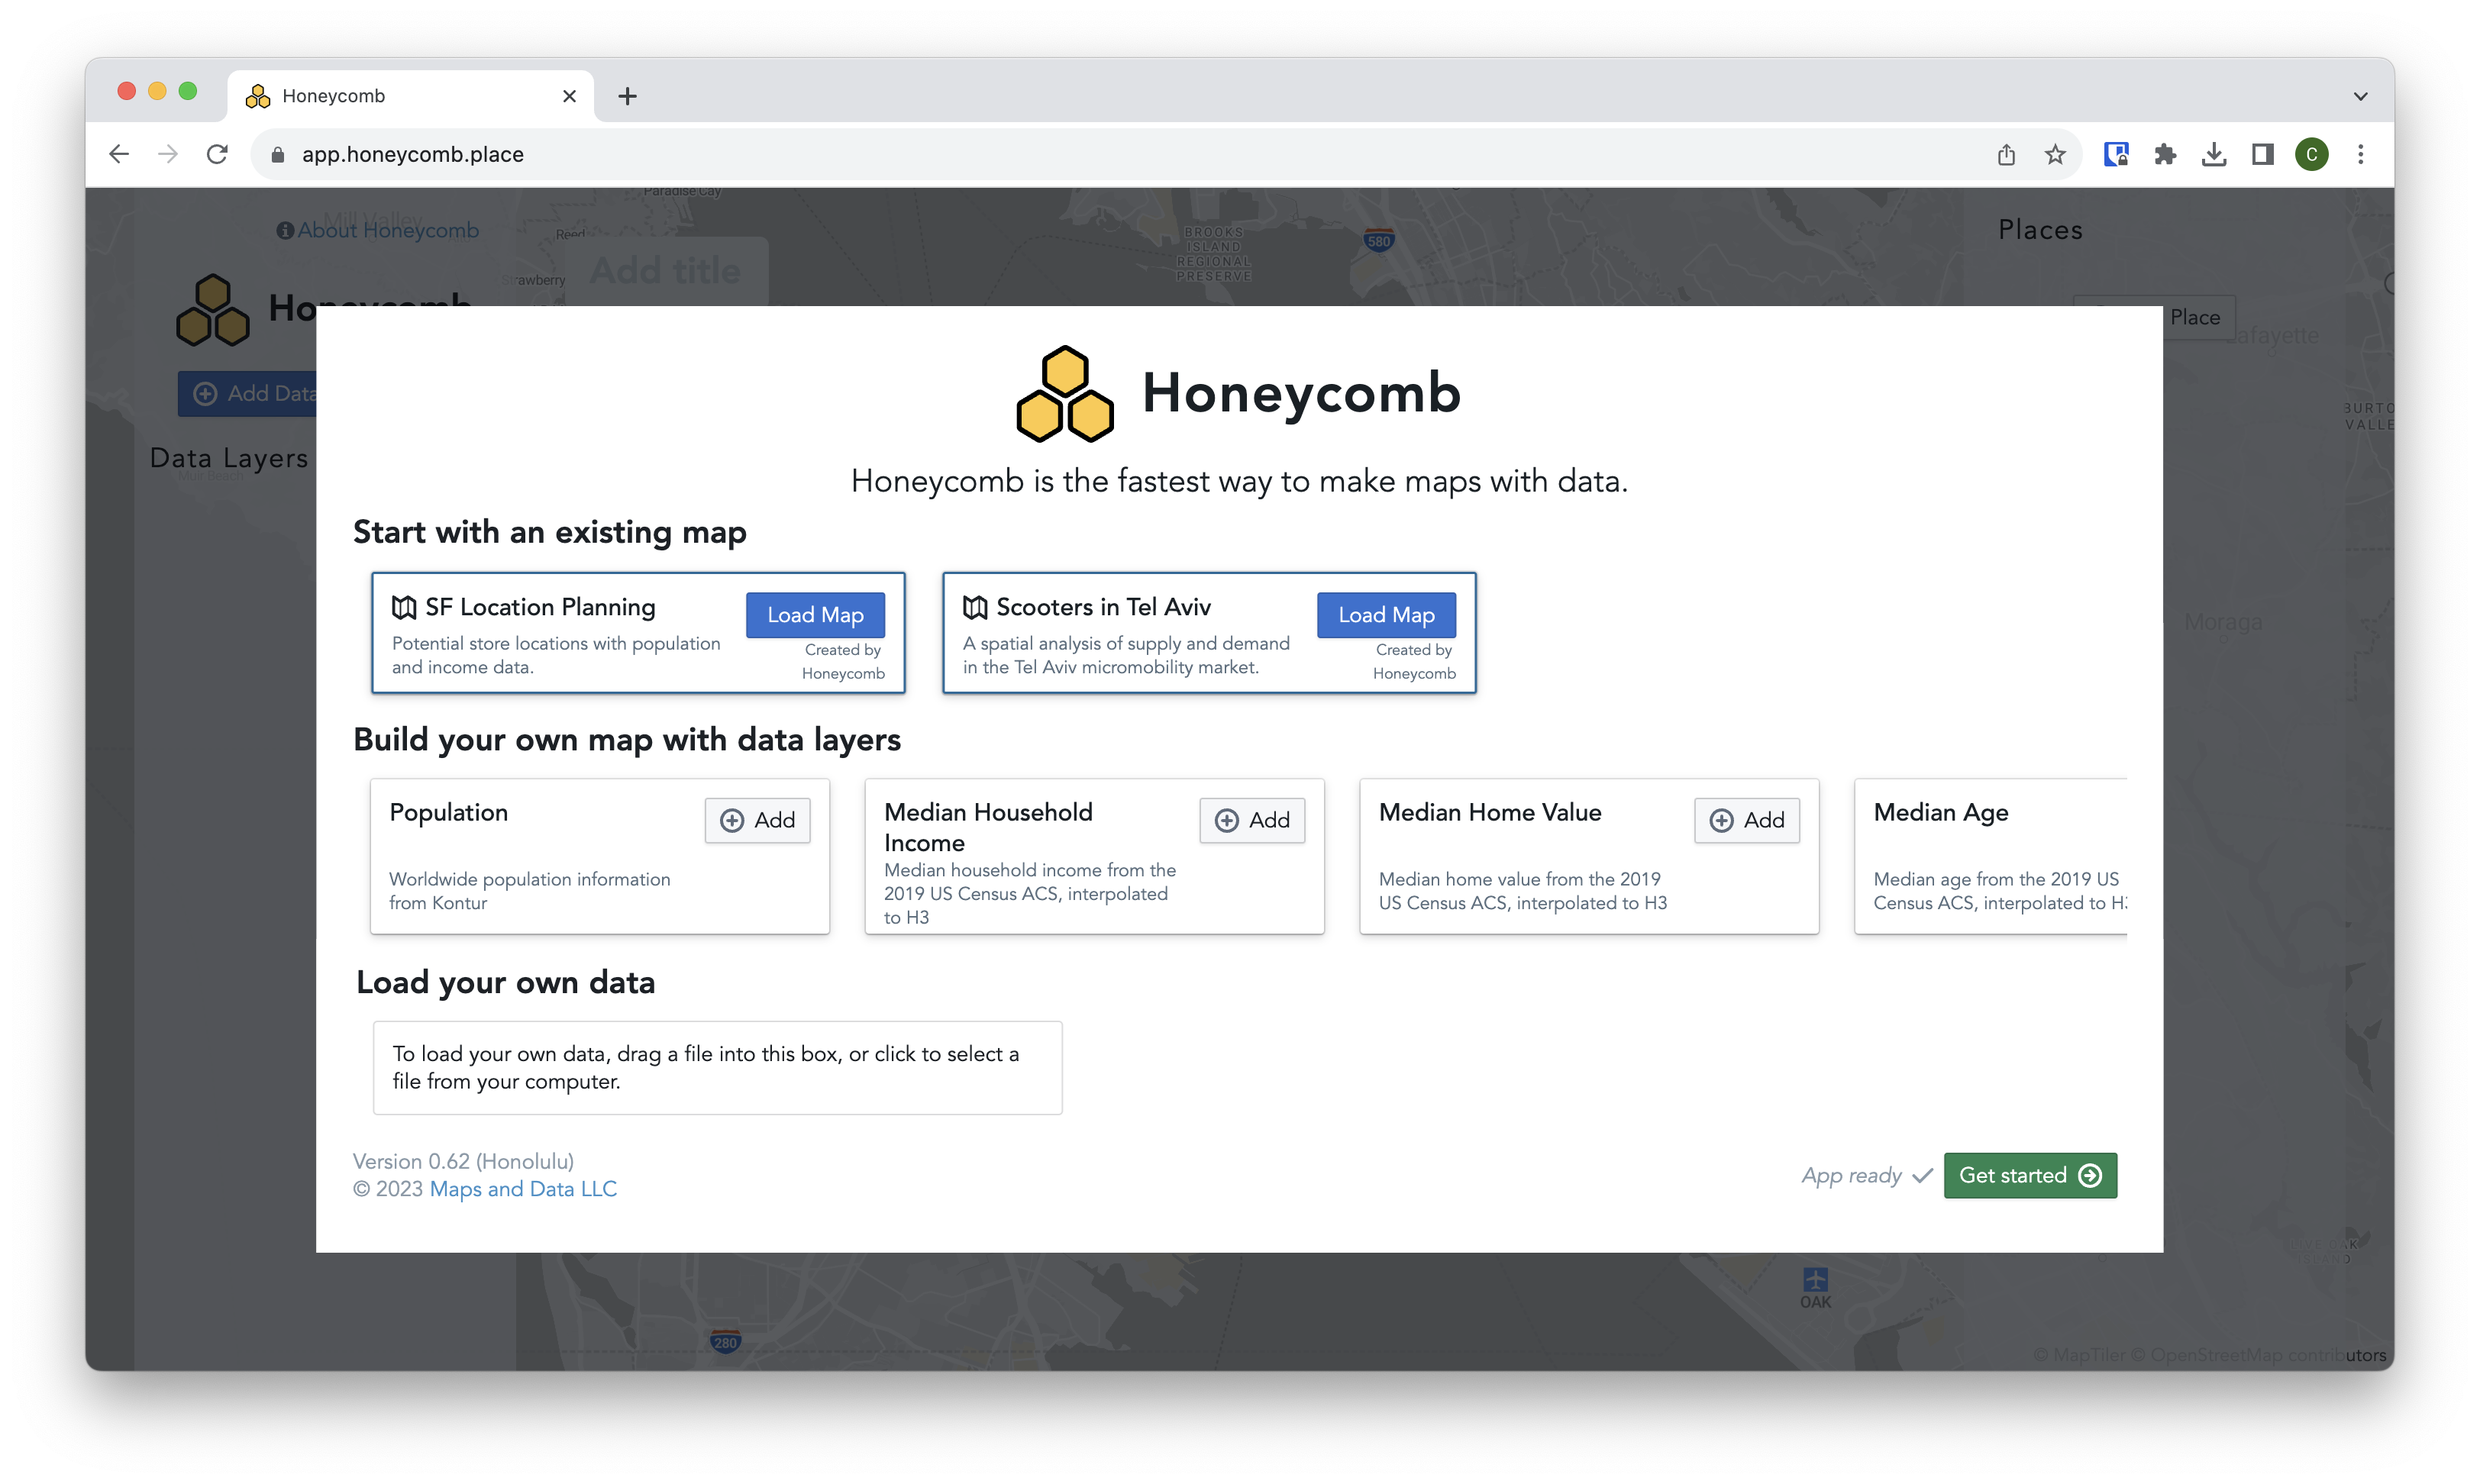
Start with an existing map
This option lets you load maps which have already been created by the Honeycomb team or other users. This is a good way to get started quickly. After you load an existing map, you can make changes to the map or even add your own data.
Build your own map with data layers
This option lets you start with a blank map but add pre-built data layers that you are interested in. This is a good way to start if you would like to create your own analysis for a specific place but don't have any of your own data on hand.
Load your own data
If you have files on your computer with data you'd like to analyze using Honeycomb, you can either click on this box to select the file, or just drag the file into the dropzone in the box. See Data Formats for specific information about the types of files you can load into Honeycomb
TIP
If you'd like to load data from a remote file URL, click on 'Get Started' to skip to the empty map, then click on the 'Add Data' button, and then click on the 'Remote File URL' option on the left.
🗺️ FOLLOW ALONG
Click on the 'Population' layer in the 'Build your own map with data layers' section. This will add the 'Population' layer to the map. Then click on 'Get Started'.
Map overview
After you click 'Get Started', you'll see the main map page: 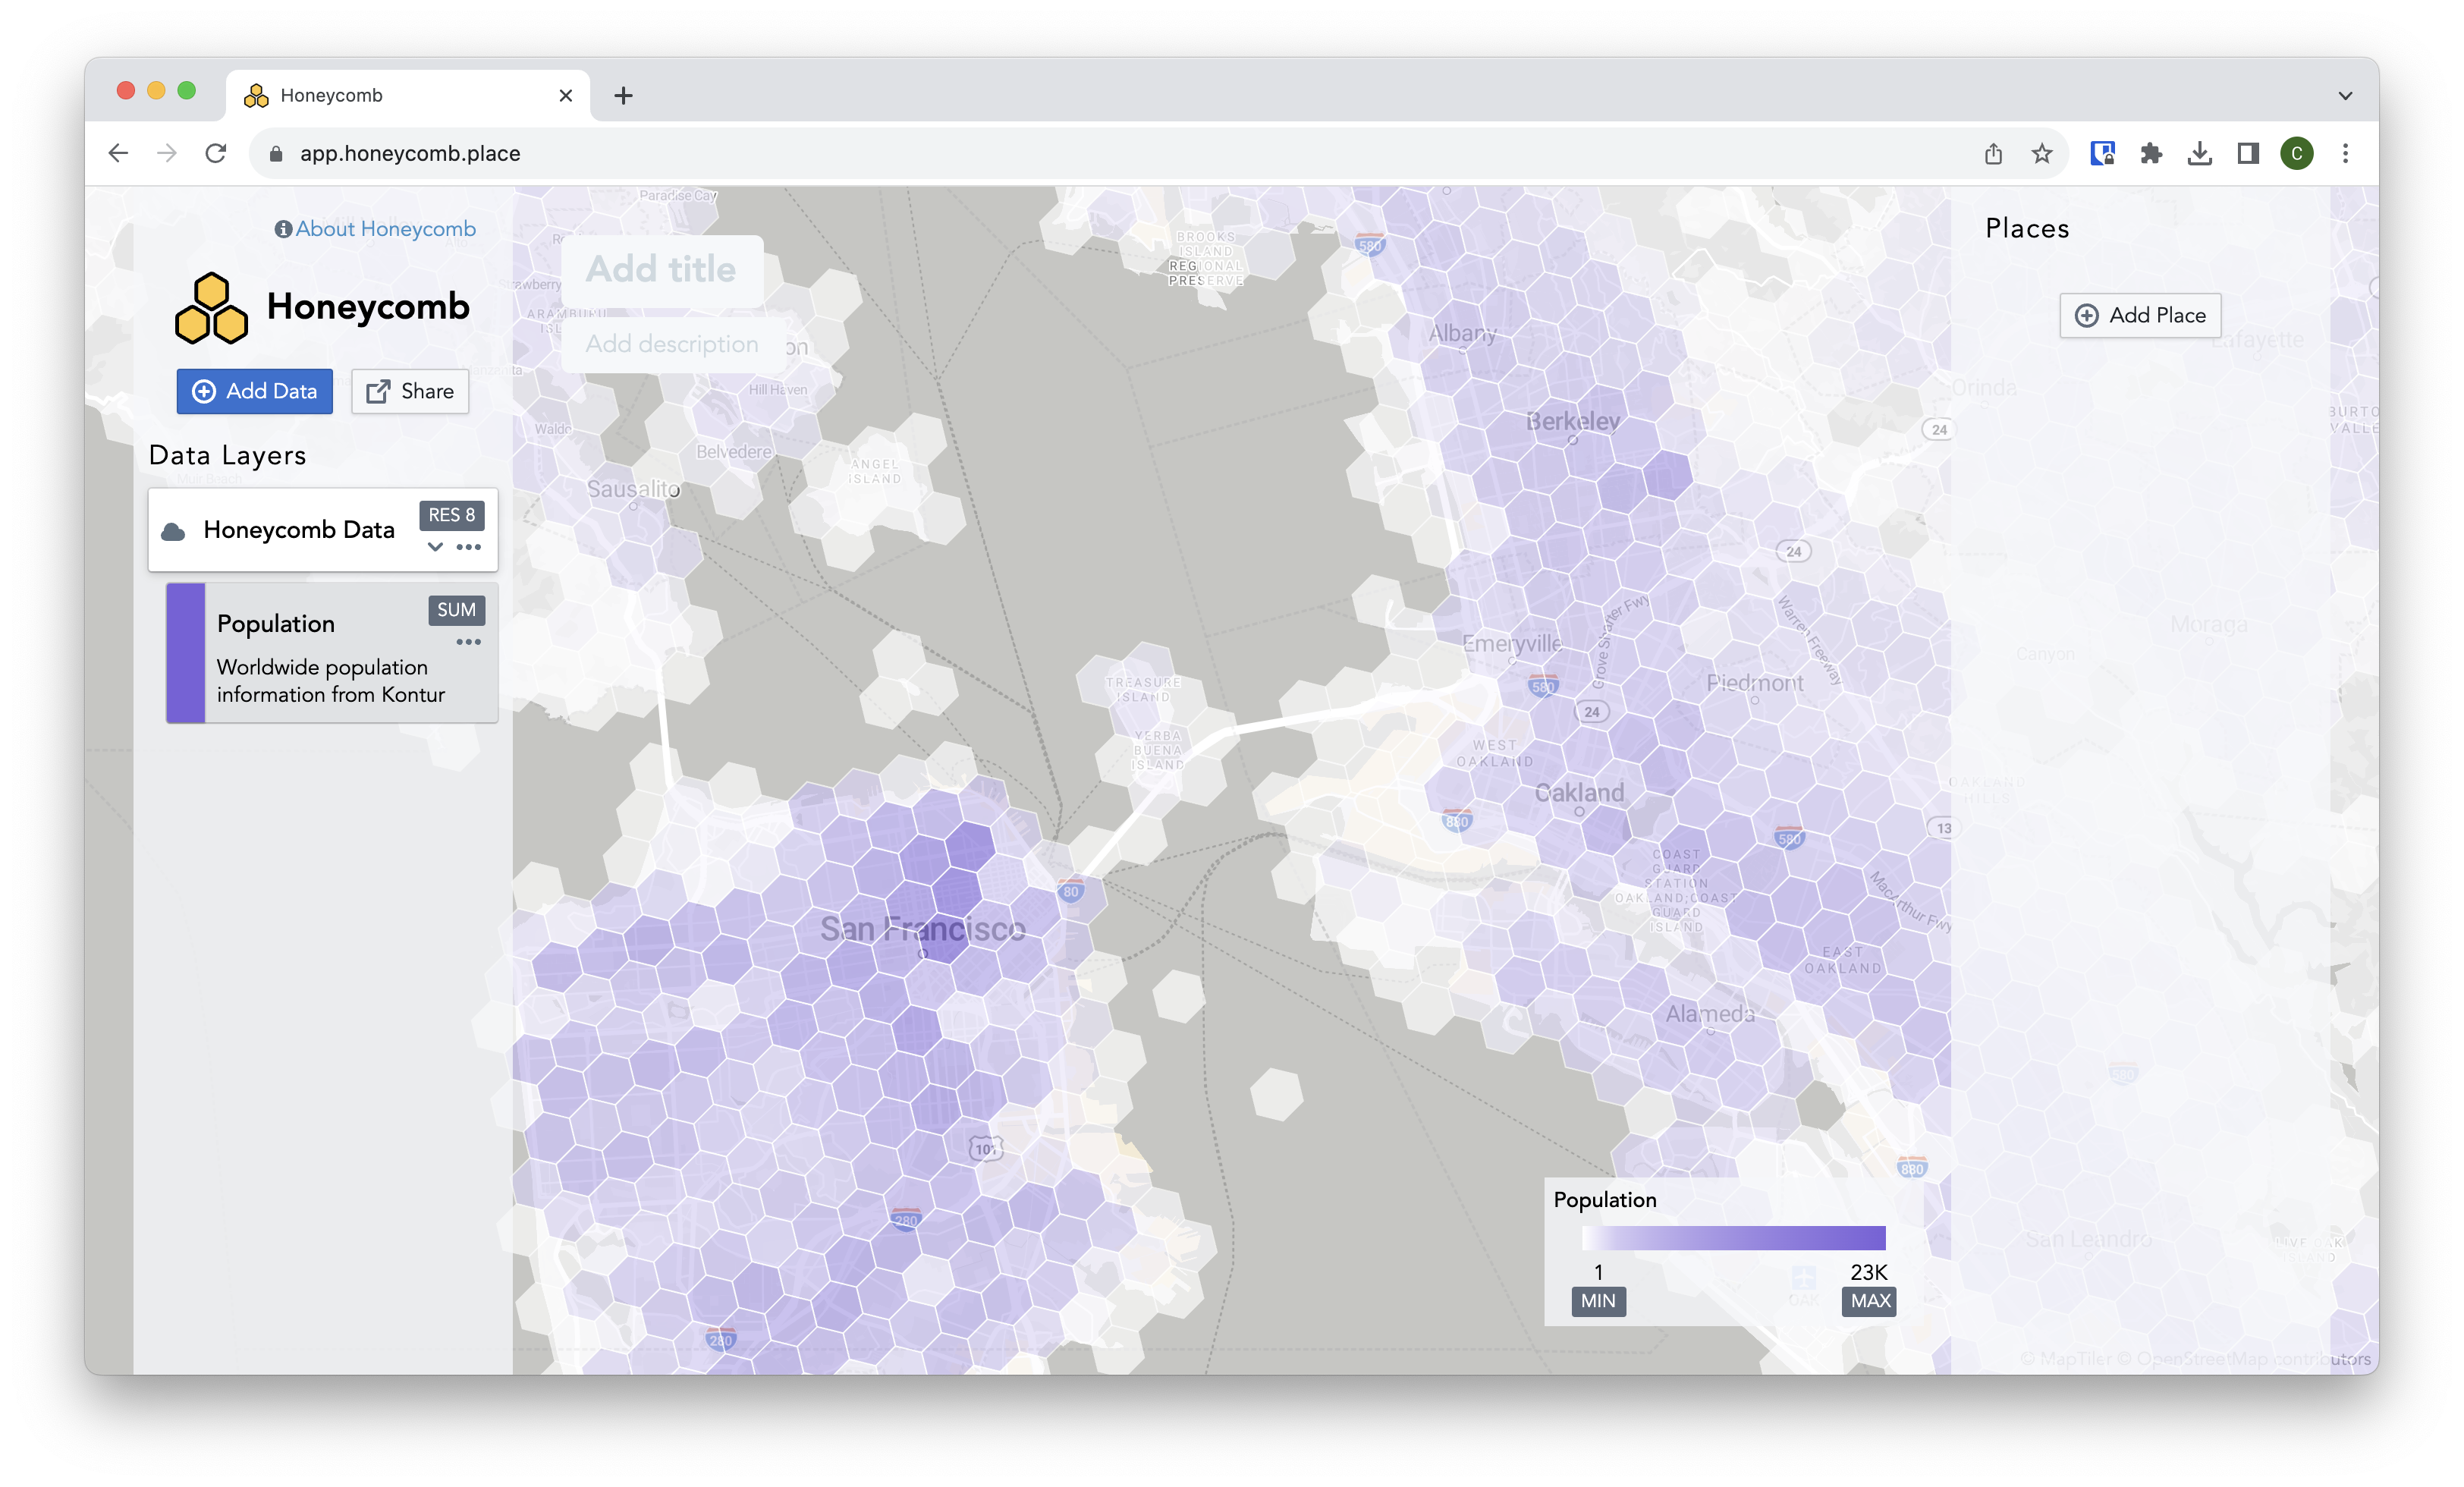
There are a few things you can see:
- On the left side is the Data Layers sidebar. This shows the data sources (files or locations data is coming from) along with the data layers which come from this data source (specific columns or fields). Since we added the 'Population' layer, you can see that we have a single data source named 'Honeycomb Data', and a single data layer named 'Population'.
TIP
Data sources can either be local files (from your computer) or remote files (from a URL or web address on the internet). Local files will show a 'floppy disk' icon to the left of their name, while remote files will show a 'cloud' icon. We'll talk more about the difference between them when we get to sharing maps.